Home | Jeremy Côté
Bits, ink, particles, and words.
Seamen hurry near the harbour, making final preparations for their vessel. They crunch through a blanket of red, orange, and yellow leaves. Their destination: Europe. A cool wind reminds them to keep working, anything to keep warm against the falling temperatures of autumn. It’s October 15th, 1657, and it’s departure day for the ship docked in the St. Lawrence River near Québec City.
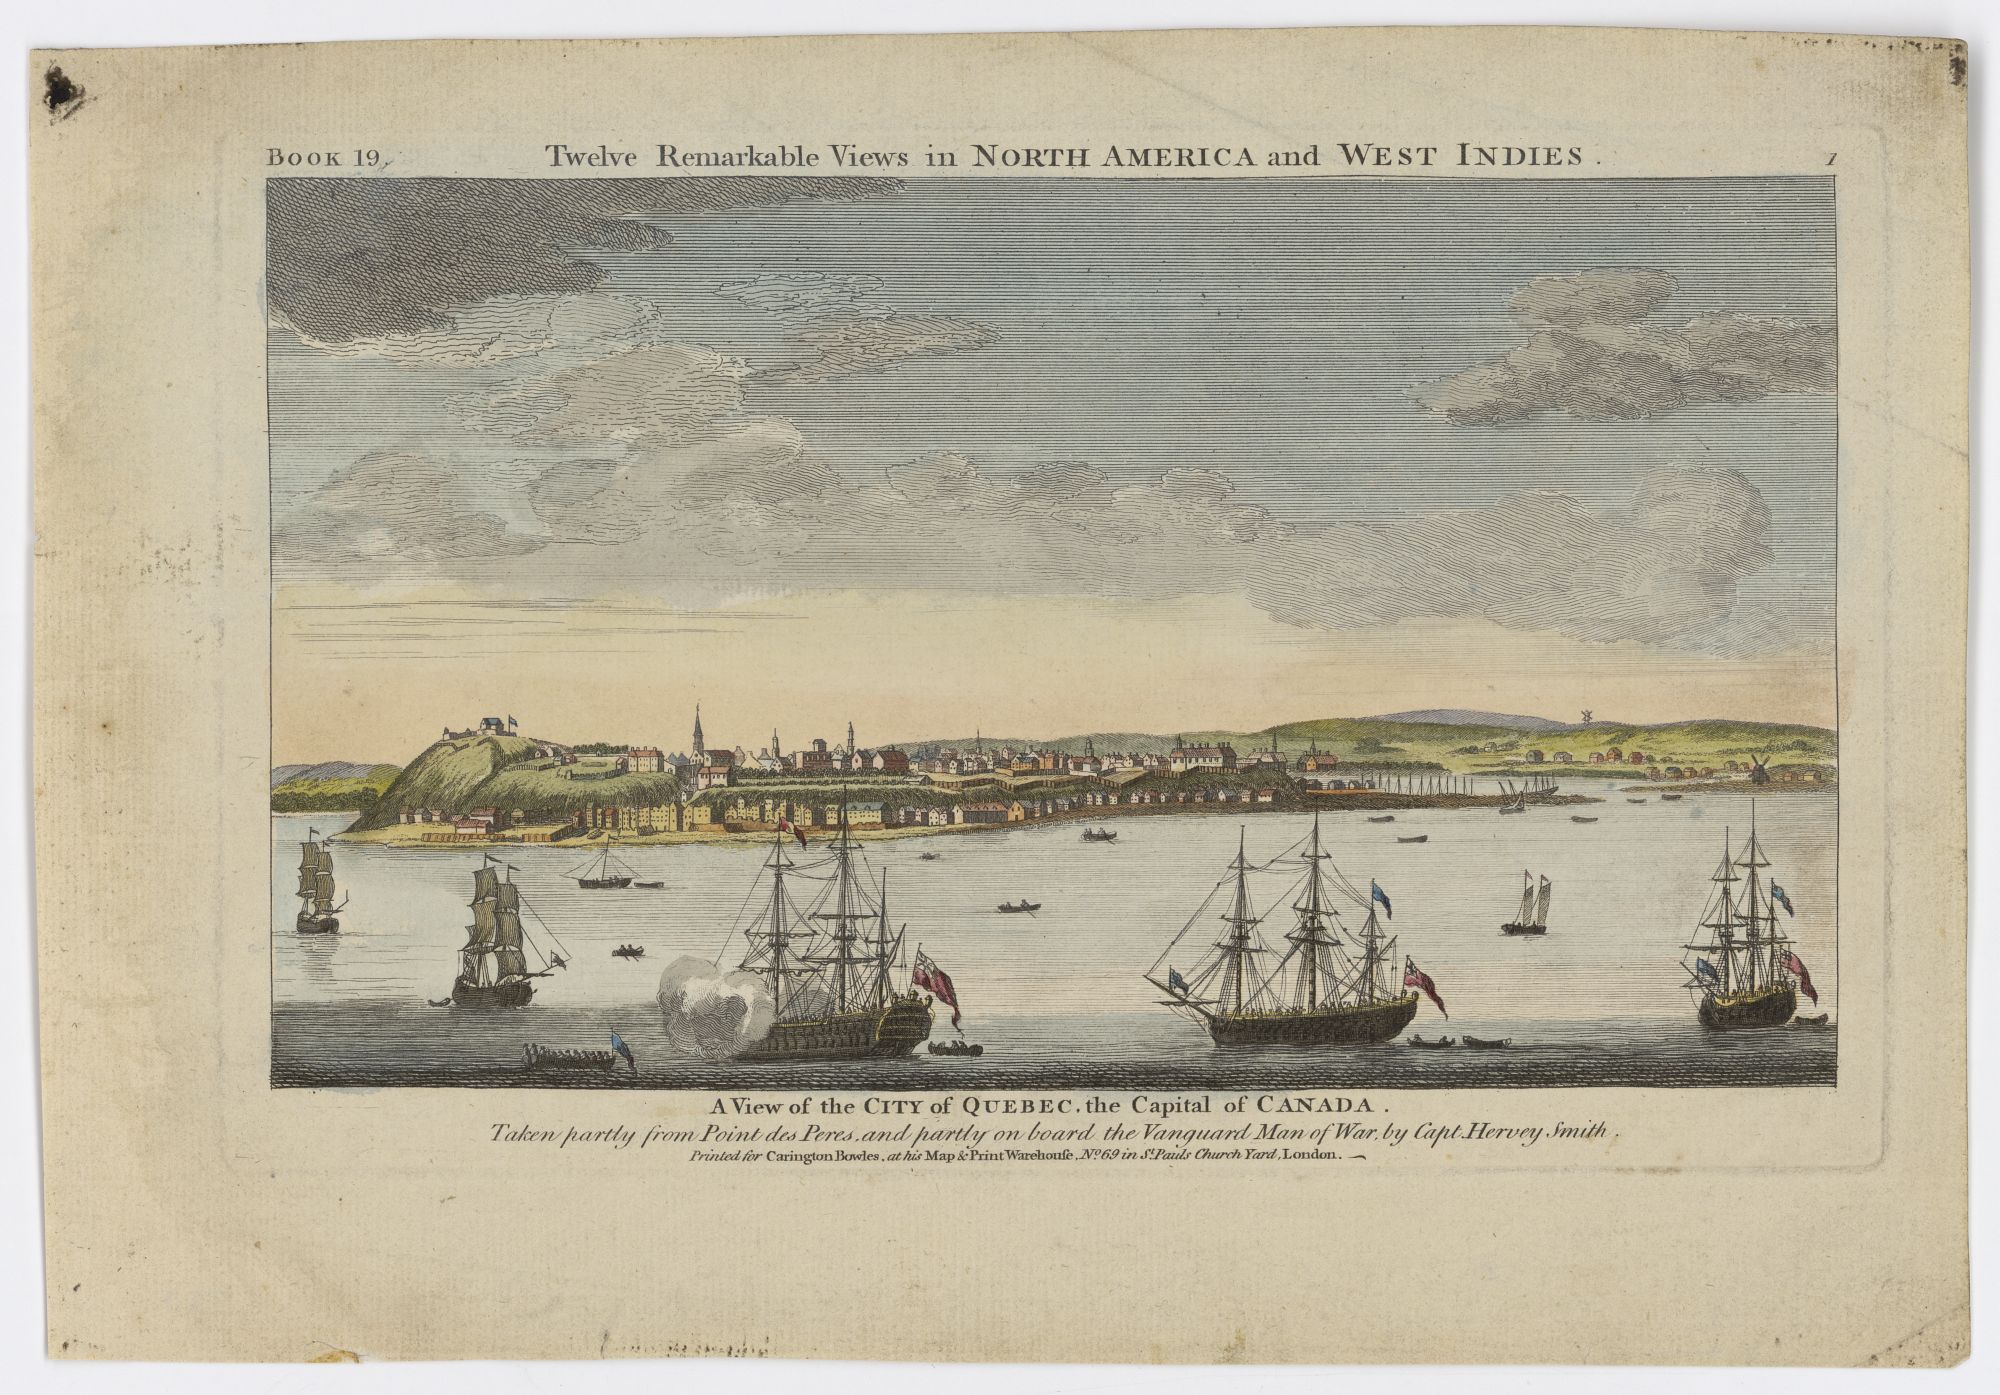 A view of Québec City around 1760, a hundred years later. Note the harbour and the small size of the settlement, even then. Created by Hervey Smith. Source
Today’s about more than just this ship, though. It’s the final outbound trip to Europe before the cold and ice arrive, making travel down the mouth of the river impossible. For the winter, the colonists in Québec City will have to be self-reliant.
Before they raise the anchor though, several colonists have approached the sailors, asking if they could carry their correspondence. This is their final chance to send any letters to their loved ones back in Europe.
One of these people is probably Marie Guyart, a founding member of the Ursuline convent here in Québec. As Jane E. Harrison recounts in the introduction of her PhD thesis (where I learned of this story), this is the final time Marie will be able to communicate with her son Claude before the ice closes her off from her homeland. After today’s letter, she will have to wait until the snow melts, the plants bloom, and the river thaws out before voyages begin anew.
The communication cadence between a colonist in Québec (New France) and a resident of Europe would be agonizing by our modern standards of email. “They’re taking _forever _to reply” wasn’t hyperbole but a fact of life. Remember: a voyage across the ocean took weeks or months, even during the summer. This delay increased the stakes of each letter, turning letter-writing into a sort of art form. There wasn’t any official postal service at the time to deliver mail throughout the colonies and Europe (though there were couriers and some individuals who would). Instead, people would often ask ships to carry their correspondence, perhaps paying them a small fee for the service. Postal organizations would only really begin in the 18th century.
Here in Québec, one big change occurred in the 18th century with the advent of a postal service connected to the burgeoning British colonies. As Harrison explains (page 2), people could continue writing through the winter by routing their letters south to New York, where ships could then leave for Europe. This development was progress in solidifying postal routes and a service throughout the colonies and enabling contact with Europe year-round. It was a slow process towards acceptance for people though, since they often could find others willing to do the job even more quickly. But over time, the postal services became the standard.
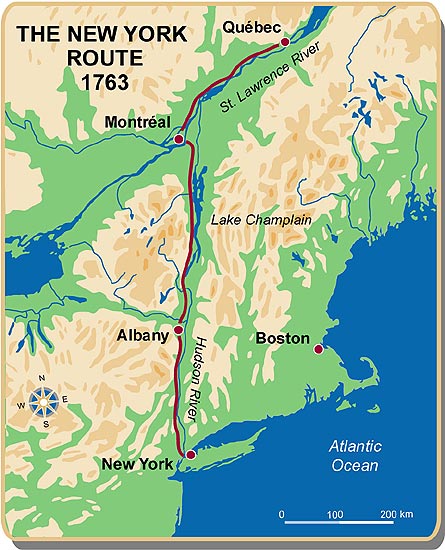 The route to New York. From the Canadian Museum of History (Andrée Héroux). Source
Steamships and railways helped propel the postal service into a faster and standardized system that people could rely on instead of entrusting their mail to random travelers (though there was still plenty of that). For example, when Canada ran its first railway line in 1836, delivery from Montréal to New York decreased by 5 hours (a 7% improvement). In my view, while technology was important, it was also important to establish regular shipping and railway routes that people could plan around. Communication delays decreased, increasing the connectivity of people who lived far away.
Still, correspondence is a far-cry from conversation. That’s fine if you’re placing an order. It’s less great if you want to keep in touch with a loved one who is far away. Electricity changed that. Over the last two centuries, humans invented and implemented the telegraph, the telephone, the radio, and finally the internet. Each one required time and effort to establish the infrastructure, but we gained enormous connectivity with people far away from us. These inventions also expanded our range of possibilities. The telegraph accelerated the post. The telephone and radio accelerated delivery of our voice. And the internet opened up the possibility for real-time video calls.
These days, I don’t think of physical space as a barrier to communication. I have friends who I’ve literally never met in the physical world. I’ve talked, laughed, and built relationships with them online, all because of our ability to harness the speed of light for our communication infrastructure. There are downsides to such a culture, but connecting with friends isn’t one of them.
If we take a broad view of history, we’ve increased our potential for sending messages across vast distances in a timely manner. Not all of the world is connected to the same degree, but most regions are more connected than they were in the past. What once could be a perilous journey across the ocean to deliver a message from a colonist in New France to Europe is now just a few taps and seconds away. This can create the illusion that connectivity is only an implementation issue since the speed of light is effectively instantaneous relative to distances on our planet.
Looking to a (hopefully not-so-distant) future in which we settle on other planets, how hard could expanding our communication network to encompass them really be?
The answer: very hard. The problem is that space is big. No, I mean really big. Just traveling to the nearest star at light speed would take over four years (and by the end, you would curse the laws of physics for such a sluggish cosmic speed limit). If we want to become a multi-world species, I wonder how the speed of light will fracture our conversations with loved ones during a trip, our calls back home when we move to new worlds, and our cadence of receiving news from other planets.
Many of us are used to hopping on a call with another person, talking in real-time. But we won’t be able to do that if we’re trying to contact someone on another planet or far-away station. It takes around twenty minutes for a light signal to travel from Earth to Mars, over half an hour for Jupiter, and over an hour for Saturn. And we’re still talking about the solar system here!
Distance is proportional to the time delay, but my enjoyment of a conversation is not. Anything up to a few seconds of delay is annoying but manageable. Ten seconds, though? I don’t think I’m going to want to have many of those exchanges. Electricity once bridged distant locations to turn correspondence into conversation, but becoming a multi-planetary civilization might force us back to a slower mode of conversation.
Imagine a young engineer traveling to Mars to begin her career. For the first few days, conversations with her parents remind her of just having a very laggy internet connection. After a week, they’re interrupting each other all the time due to roughly a five-second delay. After two weeks, she and her parents learn to pause for several awkward moments each time one of them speaks. After a month, the engineer begins reading a book while she waits for her parents’ reactions, nearly half a minute late. By the second month, she tells her parents they should simply start exchanging video messages.
Unless we’re communicating with nearby worlds, I suspect we will revert back to the cadence of email and letters, where we don’t expect a reply any time soon. That means no video calls, no online courses with synchronous sessions, and a lot more recorded video messages (or even just text).
I also wonder if it will make our worlds more isolated. After all, if I can only communicate with you through a delay, will I want to put in the effort to do so? Maybe, but I’d probably rather make friends with those on nearby worlds with a bearable time delay. Perhaps sending long-form messages with lengthy time delays will become an art form like it did for the colonists in New France. Or maybe we’ll all become experts at using asynchronous tools like remote workers currently use.
For official communication from organizations such as governments, I’m unsure what will happen. My guess would be that organizations will focus their scope around worlds they can rapidly communicate with. After all, you don’t want to wait on a reply for a time-sensitive issue because the head office of your judicial system is light years away.
The common theme: Our experience of time will probably limit the practical sphere of connectivity.
We’ve done really well at pushing our communication infrastructure to the limits of the laws of physics. Saturating them allowed us to temporarily convert correspondence into conversation. But when it comes to increasing connectivity in an expanding civilization, space always wins.
Note: I took some liberties in painting the scene surrounding October 15, 1657. However, the date and departure of the vessel do match the records. I learned of this fascinating account from Jane E. Harrison’s PhD thesis, “An Intercourse of Letters: Transatlantic correspondence in early Canada, 1640-1812”.
Thank you to Malcolm Cochran, Rob Tracinski, Heike Larson, and Camilo Moreno-Salamanca for feedback on earlier drafts.
Endnotes
Each winter, I set a goal of not slipping on ice during my runs. Each winter, I’ve failed. Bruised hips and scraped knees tell those tales. Darkness is the primary factor. A typical run begins long before there’s even a hint of morning light. My steps are never fully confident, the snow concealing potential danger on the road.
Step here, step there.
Keep my feet light.
Slow down before turning.
Watch out for snow-filled potholes.
It’s part muscle memory, part good intuition, part reflexes, and part guessing game. A small relief: On my most frequent road for dark winter running, the 9 lampposts emit bubbles of illumination. They reassure my steps, if only briefly. But near the end of the cul-de-sac lies a stretch where there are no more bubbles and it’s just me with the darkness.
This year I have hope though: My town installed an extra lamppost, providing one last bubble of light. Perhaps this year will be the year I succeed.
Either way, I soon won’t even notice the lamppost as being “new”. In a few years, I may not even remember that there was a time without its light. But it will make me safer.
That’s the nature of infrastructure: when operational, it’s an invisible supporting actor in our lives. It’s unassuming, quietly working in the background to enable everything else in my life. Imagine if I had to manually turn on my lampposts, or send a request to my town to activate these particular lights at a certain time! It’s absurd, which is why infrastructure functions best when it’s invisible.
In fact, it’s when things go very wrong—a natural disaster, a human accident, or a tipping point in a system—that we sadly remember. Infrastructure failures expose the concealed wiring of our civilization.
Amidst the deluge of useless emails came a gem that made my day.
It was December 30, 2020, in that liminal week where everything seems to stand still as we transition from one year to the next. I was in my own transition period. After completing an unorthodox master’s degree in theoretical physics, I was now a fresh PhD student trying to integrate myself in a new research group and university.
In fact, the email concerned this master’s program. It was from an undergraduate student, and it was remarkable for three reasons. First, she had enjoyed an essay I wrote about my experience in the program (when essentially the only other personal experience online was from a decade-old blog post). Second, she had also seen and loved my webcomic. And third, I had no idea who she was, which meant they had literally reached out from the goodness of her heart.
This email kicked off an exchange with the student, and I was fortunate to play a part in helping her apply and join the program. All because she did more than just read my work. She reached out.
In writing this essay, I went back and read the email. It still brings a smile to my face! Having someone take the time to write and say they enjoyed my work is such a nice feeling. It validates that I’m on the right path, doing work that matters to others, and not shouting in the void. Believe me: the usual response to my work is radio silence.
And yet, I didn’t reach out to creators as often as I could. My default was to read an article or book, take about three seconds to contemplate it, and then move on to the next thing. It’s easier to read something new than to switch contexts, find a way to contact someone, and compose a note. Each task added extra friction, nudging me away from acting until it became a habit. I was as guilty as anyone of doing this, despite knowing how lovely it is to receive a kind word from others.
As a writer and artist, I can tell you: It means so much to get a nice note from someone that says your work moved them. And for the 99% of us who aren’t so famous that we’re inundated in emails, I suspect most would be glad to hear from you. I like email because it’s personal, but commenting on their site or mentioning them on social media can also work. Who knows, you may even forge a connection with the artist that turns you from a passive reader to an active fan.
I know I did. I’m a huge fan of the mathematician Jim Propp’s monthly essays. One month, I decided to go beyond reading. I reached out, thanked him for his work, and offered to give feedback on his early drafts. I’ve done so many times since. I became an active fan, and that wouldn’t have been possible without sending an email.
Now, I fight back against my impulse to simply move on. If I come across a piece I really like, I write the creator a quick email. Nothing fancy, just a heartfelt message that expresses what I like about their work. My favourite part is hearing back from the artist who is usually so appreciative that I took the time to reach out. I try to do this a few times a week because it’s a kindness that costs me so little yet provides the artist so much.
For a medium we often associate with busywork and drudgery, email also offers us an opportunity. Whose day will you make by sending a note of appreciation?
Thank you to Jennifer Morales, Jeff Giesea, Robert Tracinski, Becky Isjwara, Sarah Khan, Michaela Kerem, Tina Marsh Dalton, and Alex Telford for feedback on my initial draft.
The first thing I do each morning is check the weather forecast. As a morning runner in Québec, Canada, I can be in for the full spectrum of conditions: rain, blizzards, ice, darkness, sunshine, wind, and anything between 25 and -30 degrees Celsius (77 to -22 degrees Fahrenheit). And to top it off, 2023 seems to have been the year of poor air quality due to rampant wildfires north of where I live, leading me to follow the weather more closely.
Missing a few runs isn’t fun, but the stakes are much higher for others. Just this year, we’ve seen wildfires from all over Canada that look poised to impact the economy, weather disasters in the US totalling over $57 billion in damages, and a bunch of extreme heat events all over the world which pose a danger to residents in those areas. Being able to know when the conditions are ripe for fires or when major storms are on the horizon literally saves lives. For people in agriculture, having an idea of future conditions enables them to plan ahead. For the aviation industry, weather forecasts make flights safer.
Today, our weather prediction infrastructure sprawls across the land, sea, and skies of Earth, and even extends into space. It collects hordes of data each day, and our massive computing power turns that data into information about our future, increasing our resilience as a species. But it wasn’t always this way.
On August 25, 1873, a hurricane hit the coast of Cape Breton Island in Nova Scotia, Canada, surprising residents and killing somewhere between hundreds and a thousand, while also destroying ships and homes. The tragic part was that this hurricane had been climbing the US East coast, so Washington, DC had warned Toronto about the hurricane a day before. However, Toronto wasn’t able to pass the message to Nova Scotia because the telegraph lines were down. The result: A surprise disaster and not enough time for preparation. What would have happened if Canada had a better early warning system? What if they had their own forecasting system, so the telegraph lines wouldn’t have been a bottleneck?
It’s difficult for me to imagine not having easy access to weather forecasts, but this used to be everyone’s reality. My daily practice and the onslaught of weather- and climate-related news made me wonder: How did we set up the global system of weather forecasting that we have today?
(Note: I’ve drawn extensively from Peter Lynch’s book, _The Emergence of Numerical Weather Prediction: Richardson’s Dream _for analysis and quotes from Richardson’s book.)
Casting the weather as a physics problem
During the nineteenth century, we had very little of our current system. While people were beginning to make observations, the American meteorologist Cleveland Abbe wrote in 1901 that the predictions “merely represent the direct teachings of experience; they are generalizations based upon observations but into which physical theories have as yet entered in only a superficial manner if at all.” (Emphasis mine.)
Despite being at the beginning of what would become the “quiet revolution” of numerical weather prediction, Abbe still saw huge potential for meteorology:
“But the latter [meteorologists] are slowly building a grand structure, mathematical, graphical, and numerical, in which deductive reasoning will take the place of empirical rules. The whole will eventually form a complex intellectual machine, by means of which the general, and possibly the detailed phenomena of the atmosphere, will be followed up day by day.”
Clearly, Abbe was right. Yet he wasn’t the only one thinking about the atmosphere as a physical system that we could model and project into the future. In 1904, the Norwegian scientist Vilhelm Bjerknes described the first two steps of the forecasting pipeline: data collection and modeling the atmosphere mathematically.
This kicked off theoretical work from several scientists (including Bjerknes) on laying a mathematical foundation for numerical weather prediction. A crucial contribution came from Lewis Fry Richardson, a scientist who was a newcomer to meteorology in 1911 and wrote a landmark book over the next decade on predicting the weather from initial conditions.
His book is famous for two reasons. First, he used the tools he built in his past scientific work to go further than others at the time: he explicitly wrote down a sort of “cookbook” for weather prediction. Today, the equivalent would be finding a GitHub repository containing code for your specific problem. Second, Richardson demonstrated his procedure by calculating an example forecast from past data for May 20, 1910. This was a huge feat of calculation by hand, which he described as taking “the best part of six weeks to draw up the computing forms and to work out the new distribution in two vertical columns for the first time.”
Unfortunately, there were two major problems: his example forecast was way off, and it took far too much work to carry out Richardson’s procedure. The former problem turned out to be technical issues that others were later able to diagnose and fix. In fact, Lynch later carried out Richardson’s example forecast using a computer and these technical fixes to show that the results become realistic.
The latter problem was worse. To his credit, Richardson didn’t shy away from the current impracticality of his method. He offered his “fantasy”, which involved a giant hall with about 64 000 (!) people working together in parallel to carry out his scheme across all the regions of the world. A “conductor” would stand at the centre, managing the entire computation and directing people to slow down or speed up. I encourage you to read the whole fantasy (see the previous link), but here’s Stephen Conlin’s rendition:
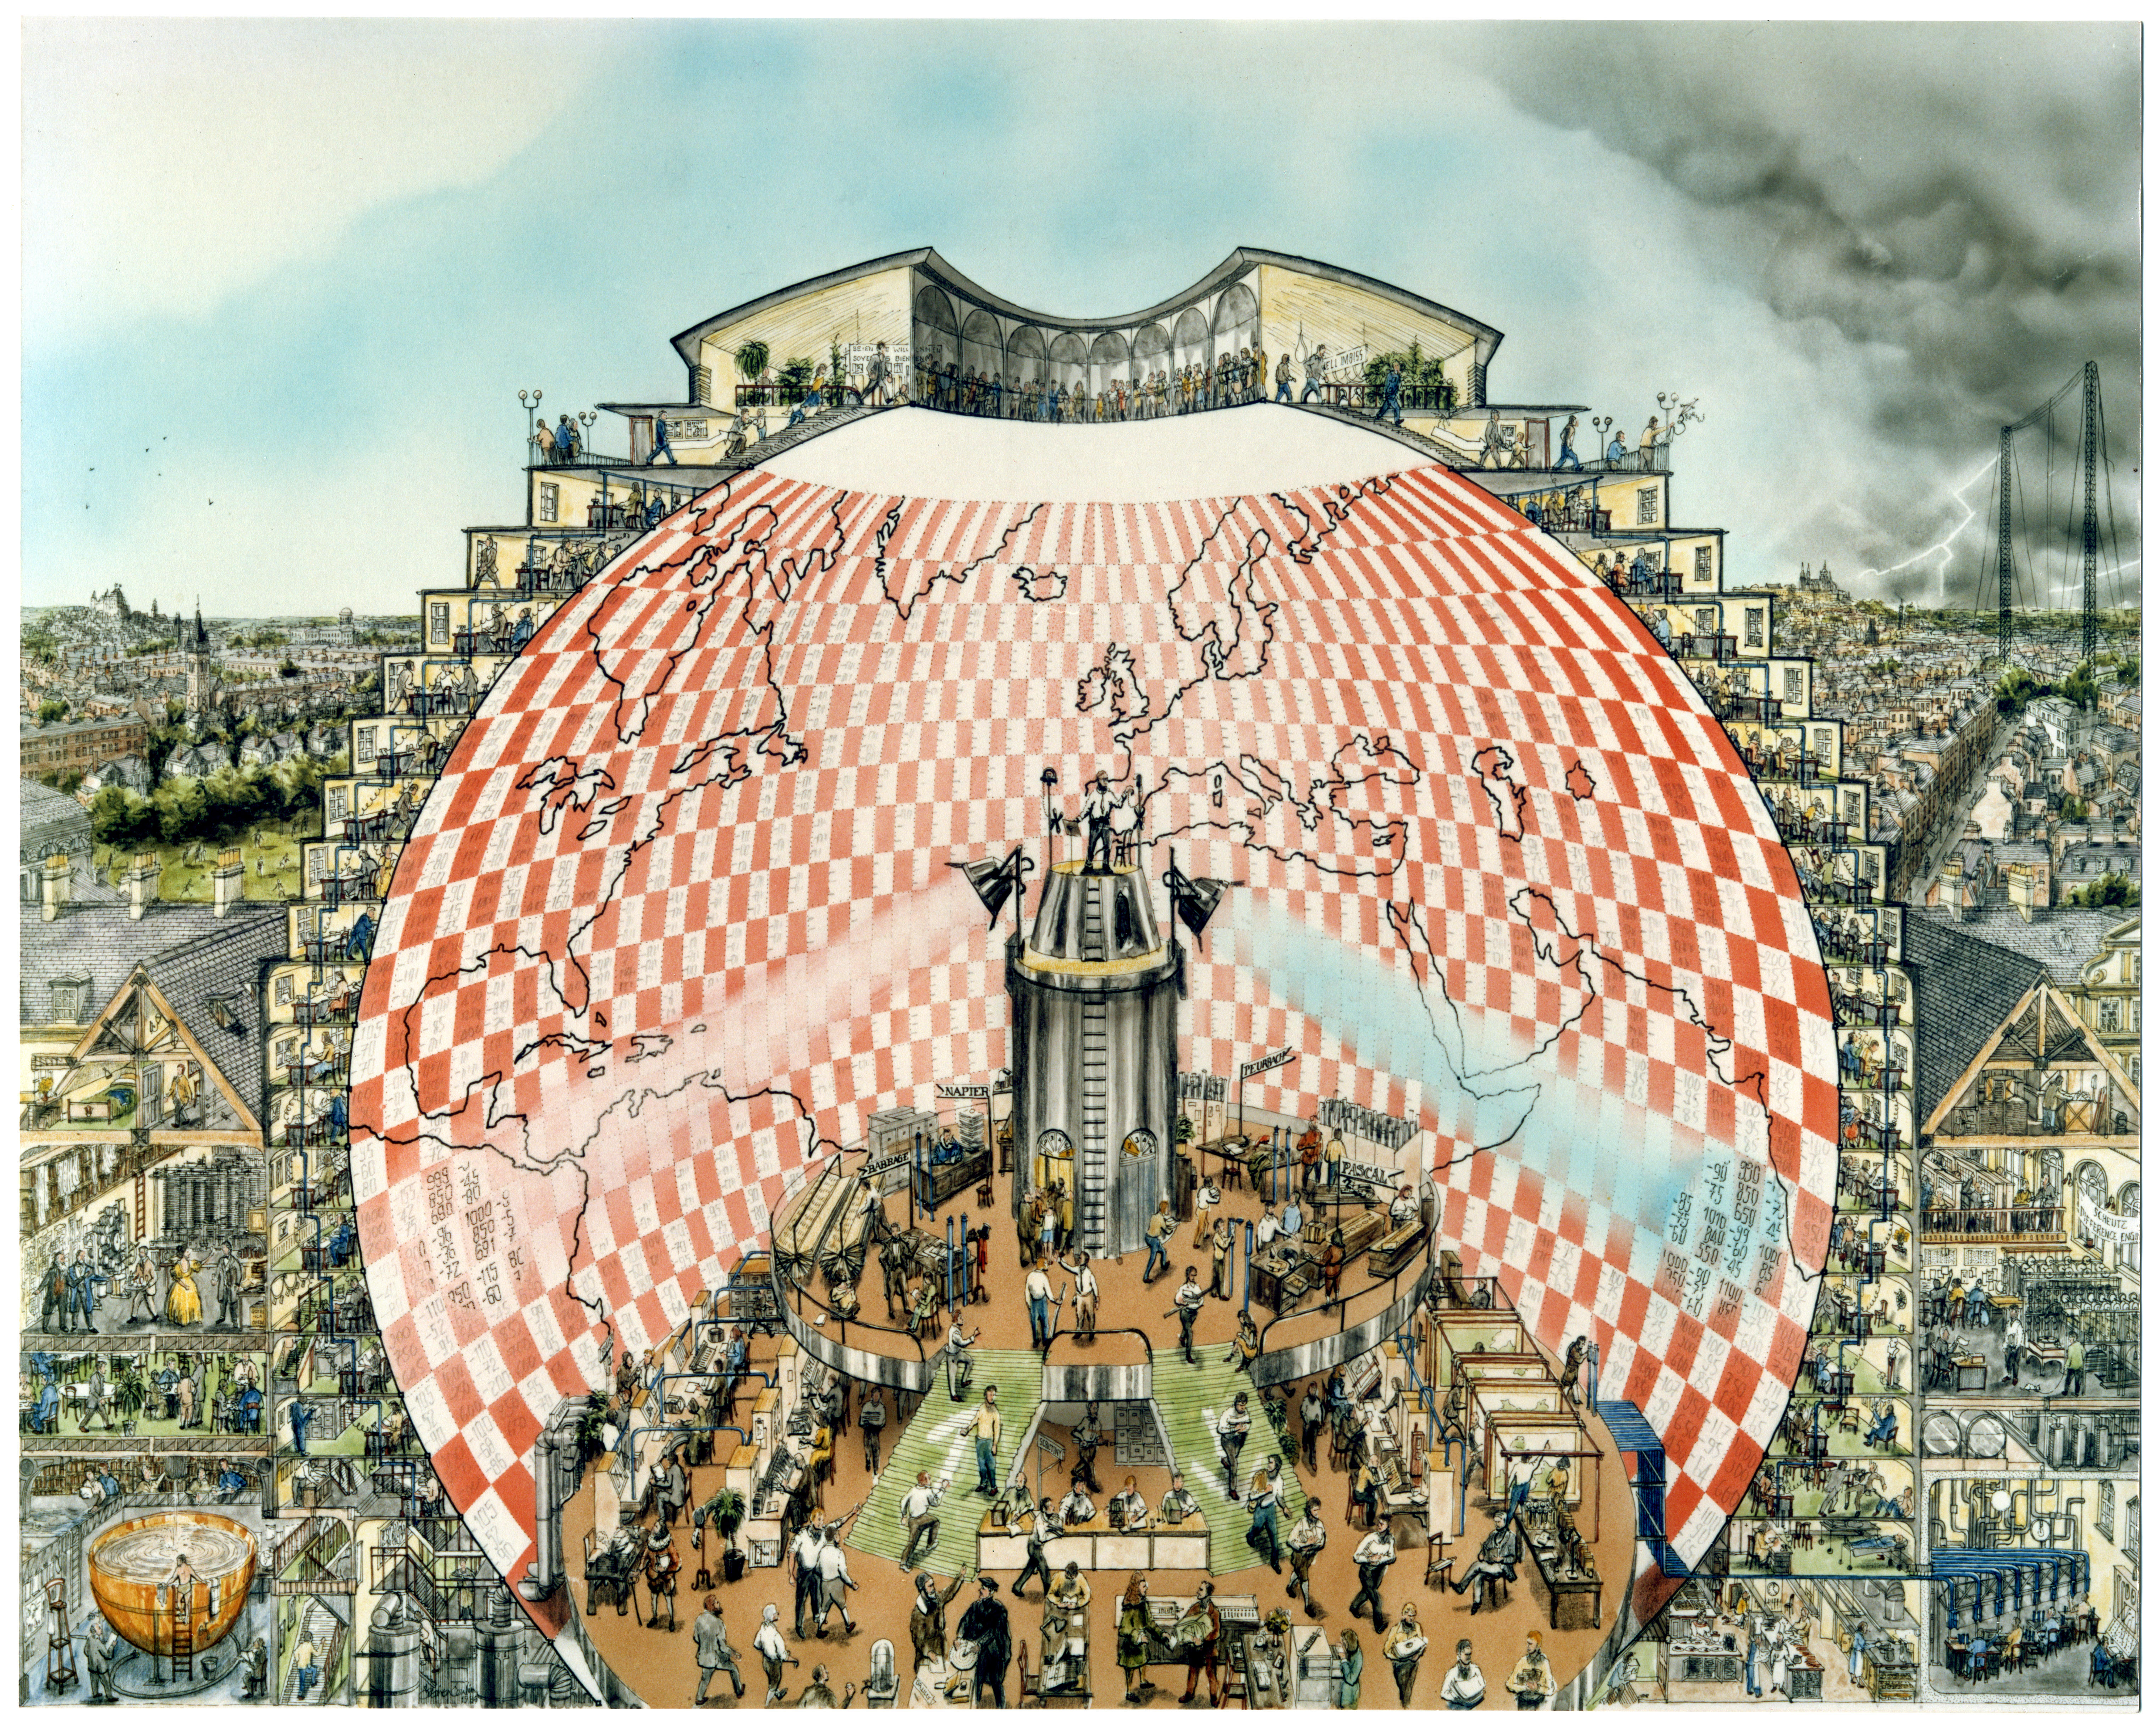 Used with permission of the artist Stephen Conlin, who owns the copyright.
In hindsight, this seems quite prescient for the computer revolution. However, these two problems were big enough that Lynch writes that, “Richardson’s work was not taken seriously and his book failed to have any significant impact on the practice of meteorology during the decades following its publication.”
This suggests to me a lesson of progress: A good scientific idea can fail to gain traction because of insufficient resources to take it from theory to practical application. Richardson made huge progress in weather forecasting, but that progress remained latent because of his terrible forecast and the huge workload it took to use his scheme.
His work would eventually have an impact but first, we needed progress in other areas.
Turning weather data collection into automated infrastructure
Around the time that Abbe, Bjerknes, and Richardson were working on the theoretical aspects of meteorology, there was still the problem of getting detailed observations of the atmosphere across many regions. Bjerknes noted that they were far from Abbe’s “complex intellectual machine”:
“This task has not been solved to the extent necessary for rational weather prediction. Two gaps are particularly critical. Firstly, only land-based stations participate in the daily weather service. There are still no observations made at sea for the purpose of daily weather analysis, although the sea accounts for four fifths of the Earth’s surface and therefore must exert a dominant influence. Secondly, the observations of the regular weather service are made at ground level only, and all data about the state of higher layers of the atmosphere are missing.”
To give you a sense of how the quantity of observations changed over time, look at the number of land-based station over time from the Copernicus Climate Change Service:
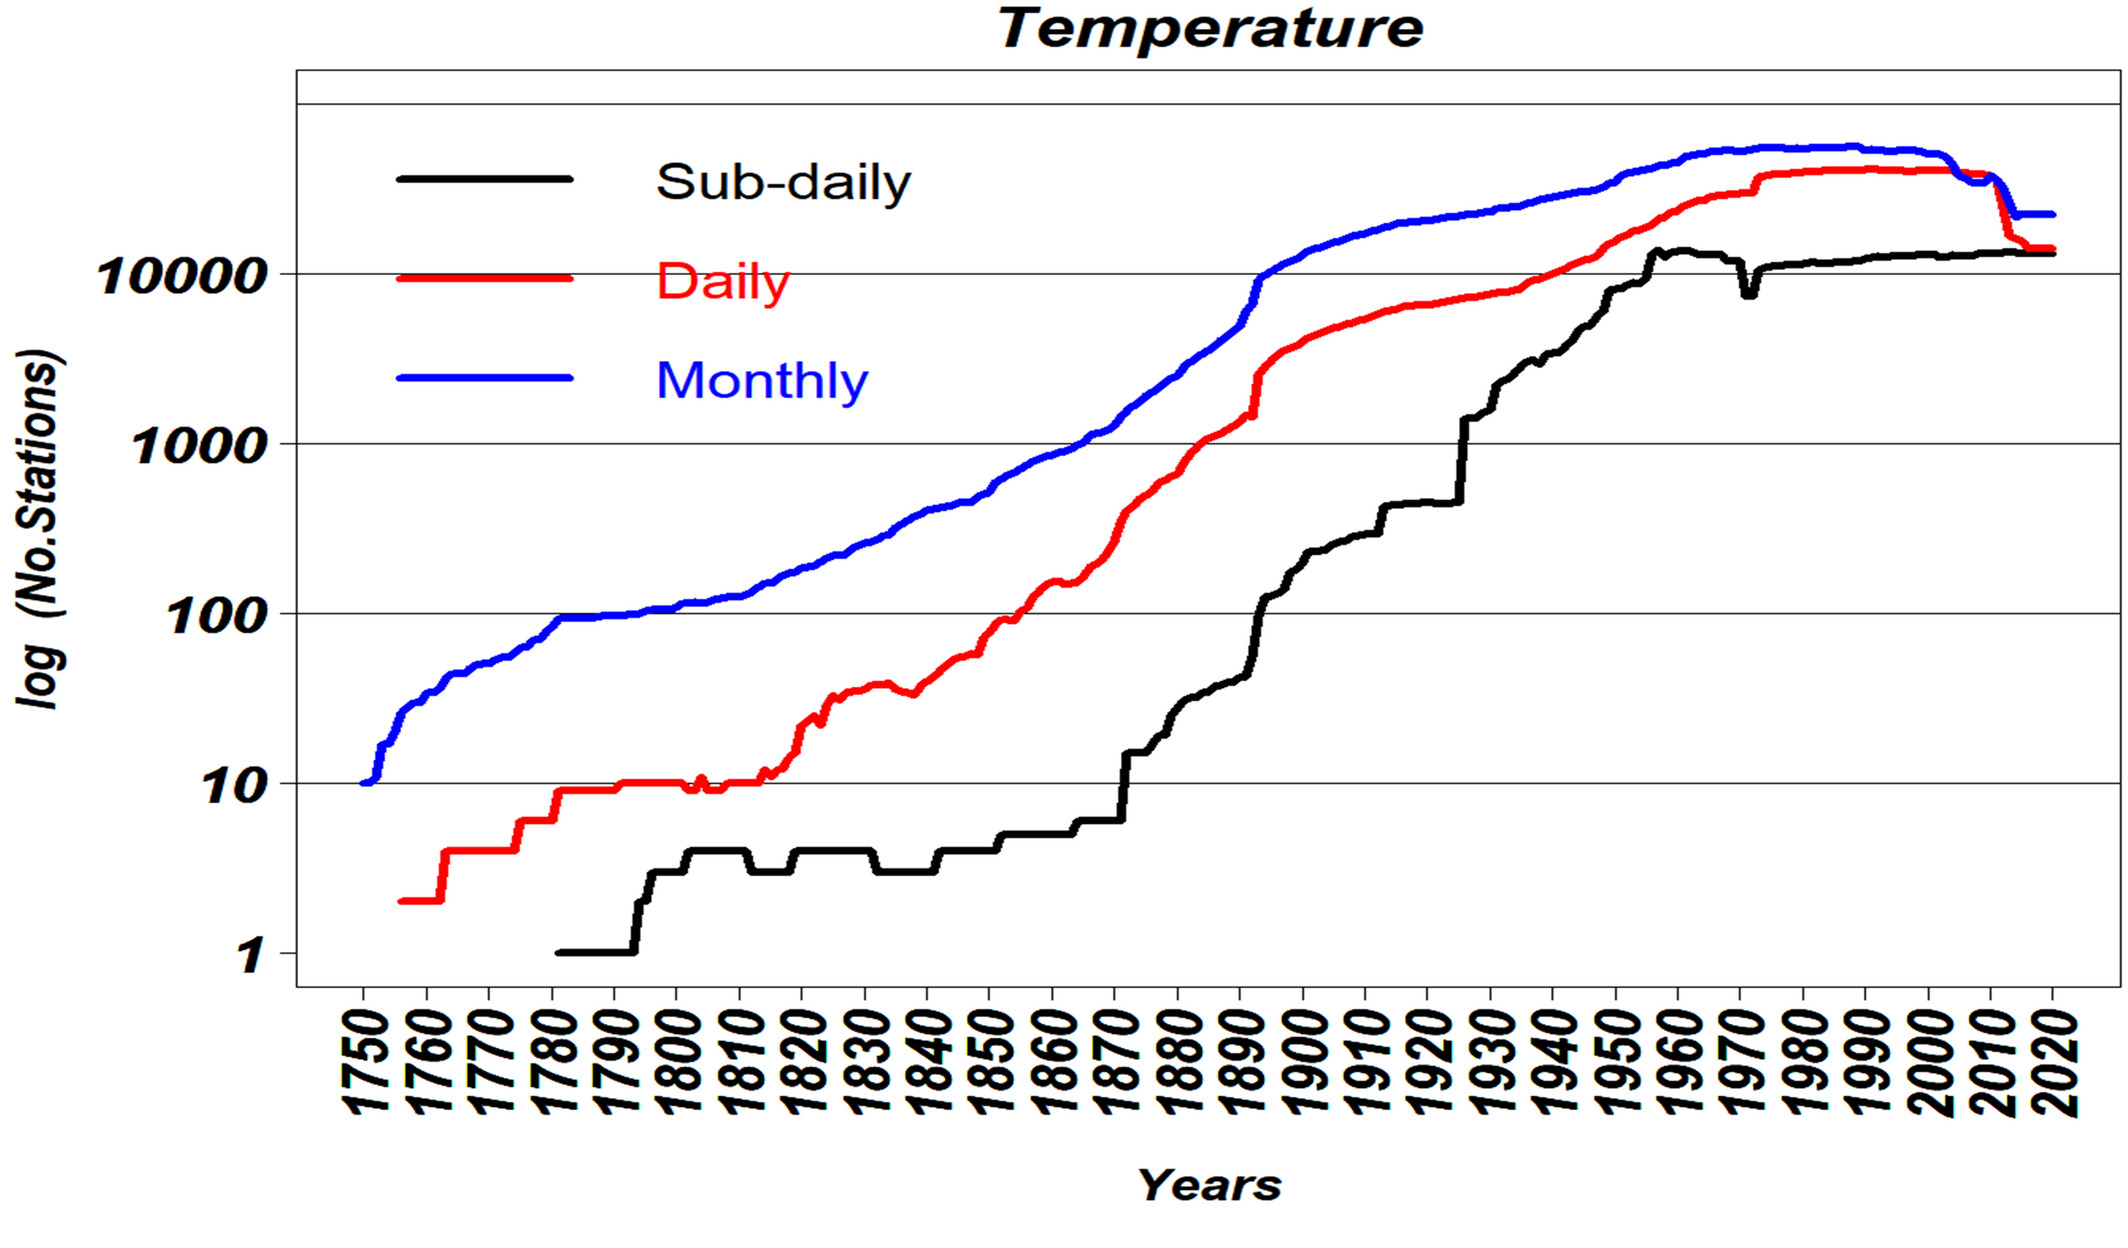 The vertical axis is logarithmic in the number of stations, and the three different curves have to do with how frequently a station collects data (sub-daily often means hourly).
You can see that at the time Bjerknes was writing (~1910), there was still a lot of improvement left. Remember, because the vertical axis is logarithmic, a small vertical shift signifies an exponential increase in the number of stations. In other words: Humans added a lot of stations in the twentieth century.
If you prefer a map-based view, here are how the stations were geographically spread out over time:
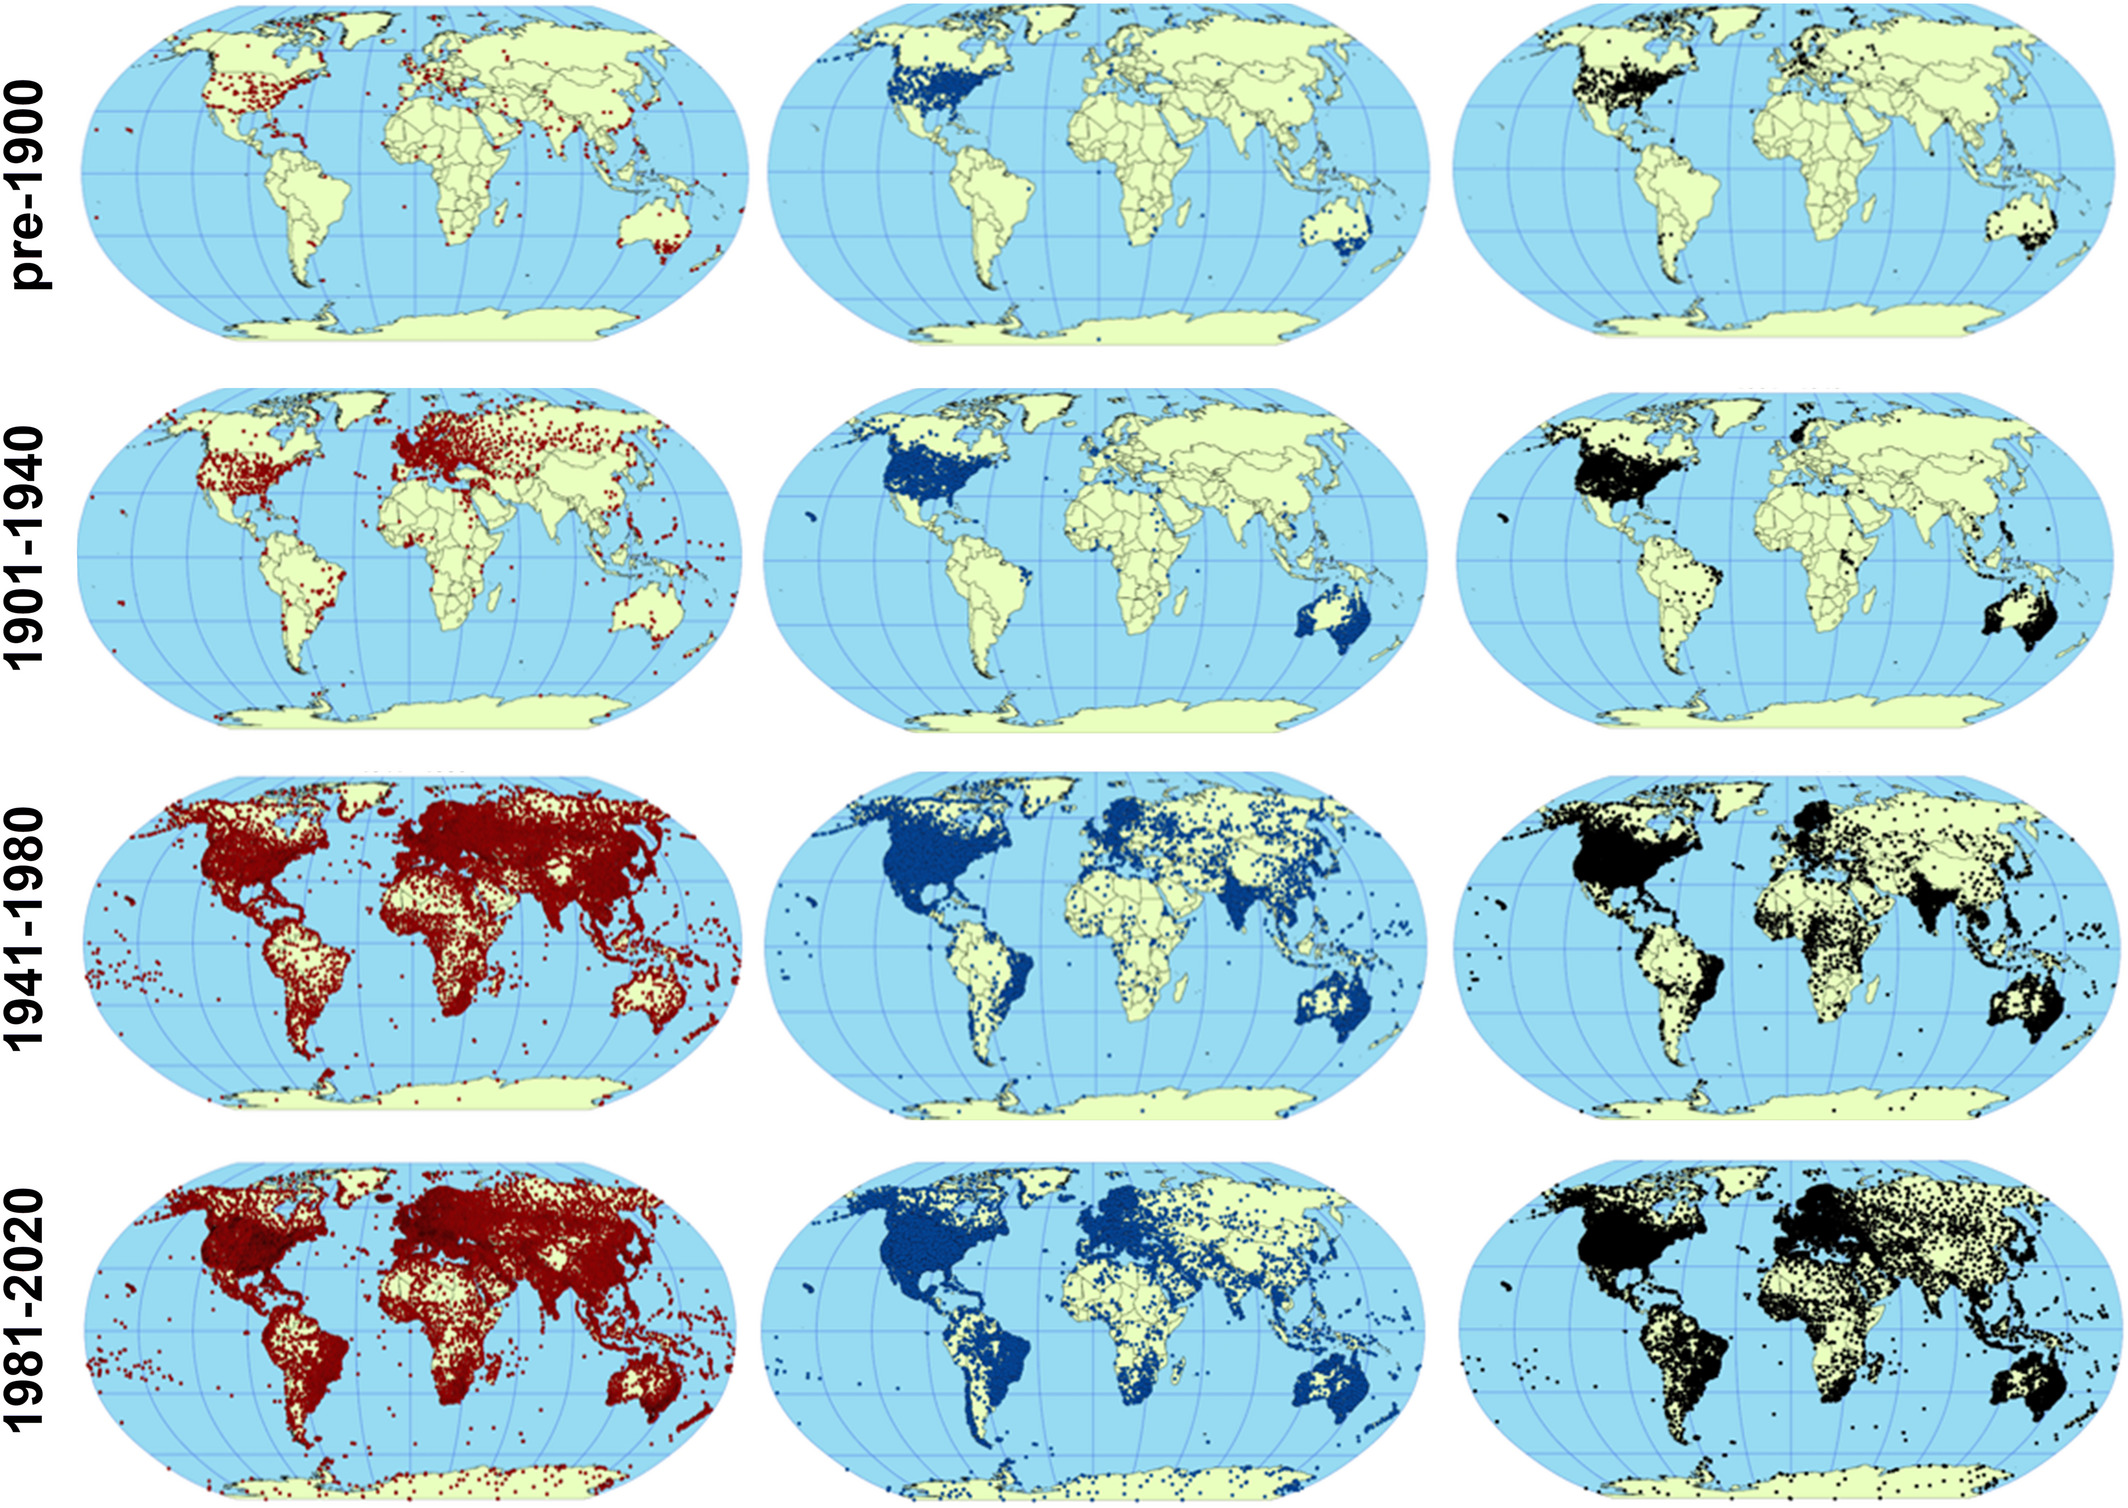 Evolution of land-based station coverage over time. First column: sub-daily observations, second column: daily, third column: monthly.
Bjerknes also mentioned the importance of sea-based observations. Using ships, buoys, and other platforms, we’ve increased those a ton over time as well.
It’s one thing to get observations on land or on the sea, but it’s quite another to collect data in the air. In the 19th century, people would travel in balloons and take the measurements themselves. Apart from the danger, this wasn’t exactly a way to set up a system of frequent observations that meteorologists could immediately use in their model.
During the next few decades, people invented better balloons and cheap instruments that recorded on their own. This removed the danger of going yourself with the tradeoff of having to find the weather balloon once it landed.
Still, you only got the data once you found the balloon. There was a delay, which reduced the time meteorologists had to make their forecast using the data. What would be even better is if the instrument could transmit the data directly to the ground.
That’s what meteorologists began using around 1930. The basic setup was essentially a radiosonde (a recording instrument) attached to a parachute, which was attached to a balloon. The radiosonde would transmit back to a station during the balloon’s ascent. As the balloon gained altitude, it would expand and eventually pop. Then, the parachute would deploy, hopefully salvaging the device.
More ways of collecting weather observations came online: airplanes, radar, ships, and eventually space satellites. These now form our global system. Consider the operations of the European Centre for Medium-Range Weather Forecasts (ECMWF). Their current system collects about 800 million data points each day and looks like this:
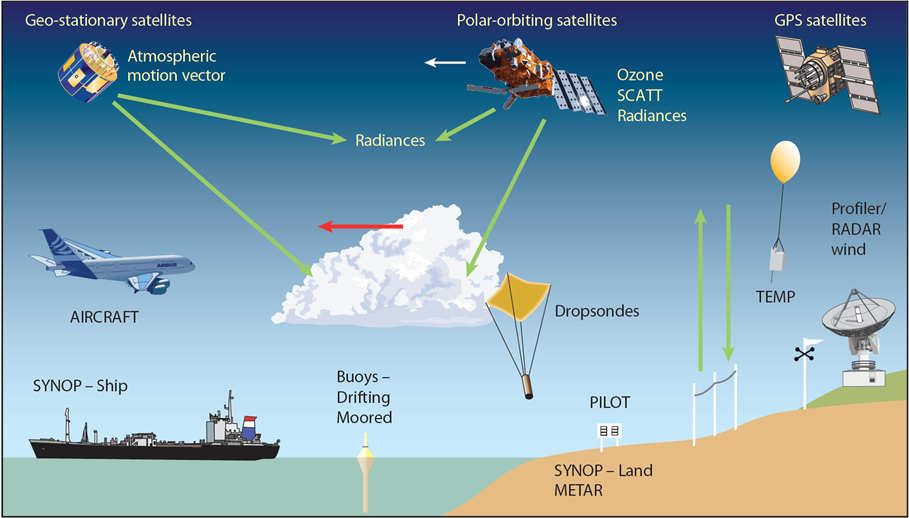 The range of instruments ECMWF uses to collect weather observations.
And if I look at the land and ship coverage for October 6, 2023, I find:
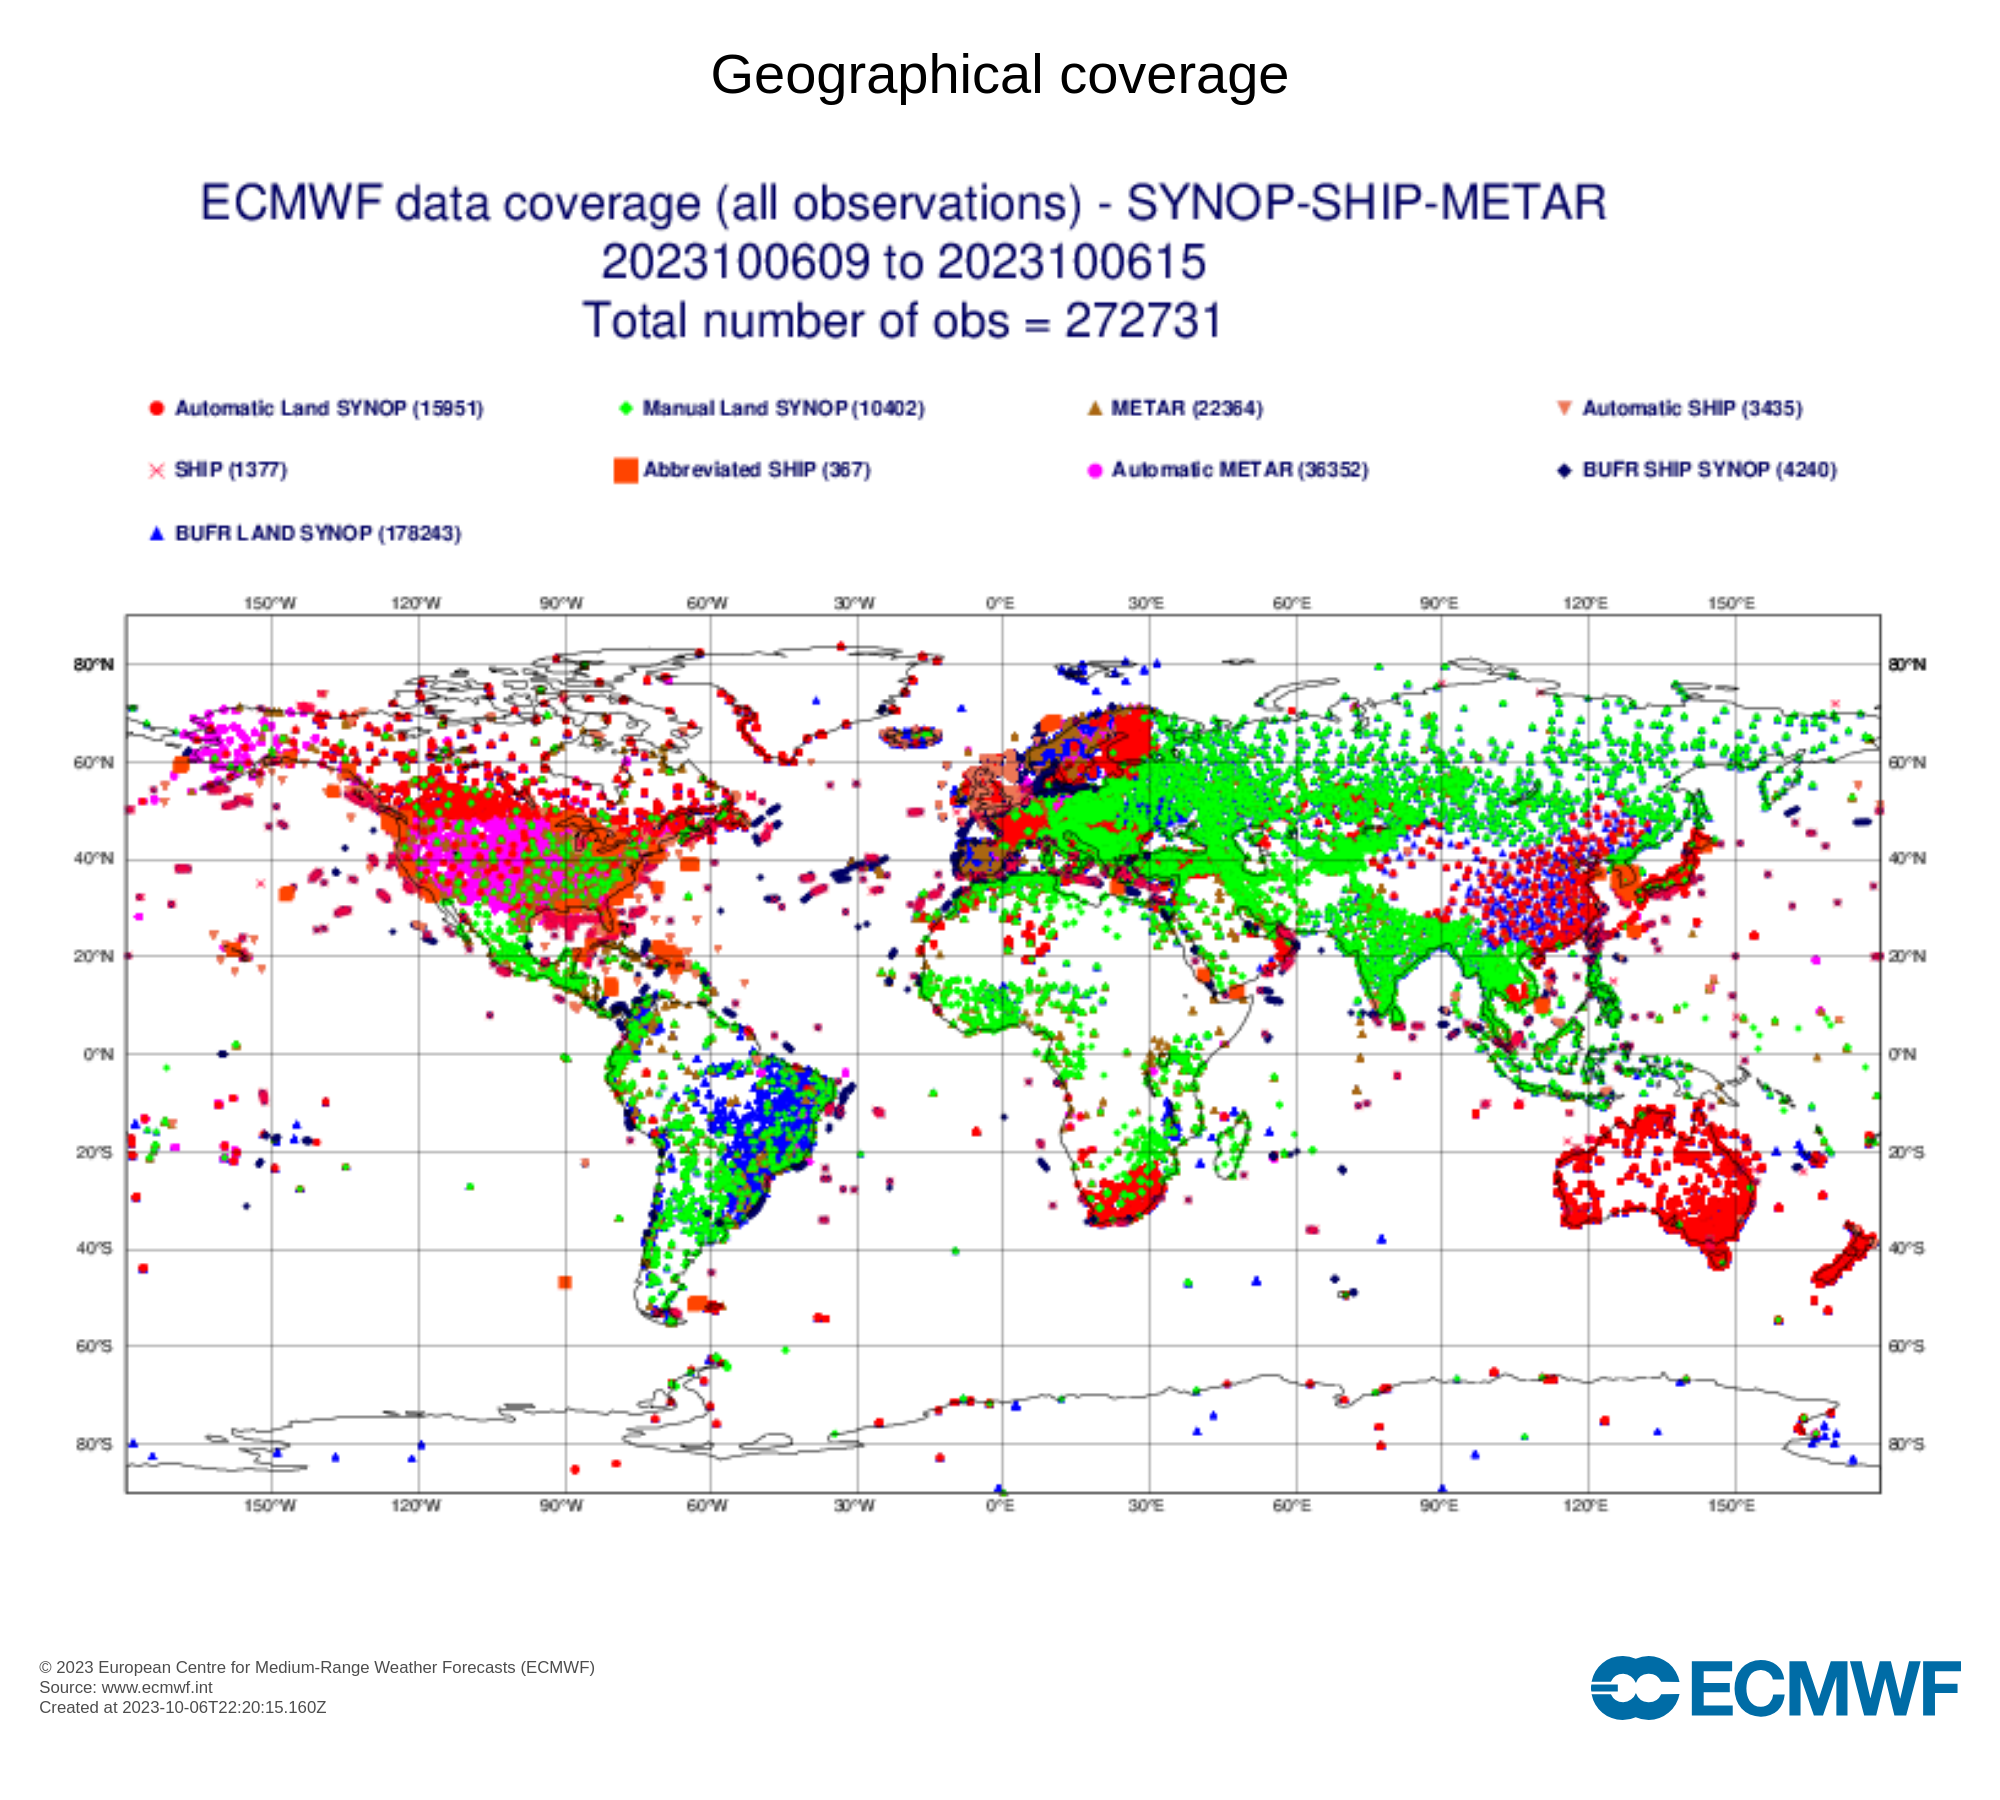 You can see that we now have a *lot* of observations across the world.
To ingest all that data though, we needed computers.
Unlocking operational forecasting with computers
Computational capacity was the other piece of the puzzle missing from Richardson’s fantasy. Progress on that front began in the 1940s, with John von Neumann launching the “Electronic Computer Project” at the Institute for Advanced Studies. Out of the four groups, one of them was “Meteorological”.
The meteorologist Jule Charney headed the latter half of the project, and by 1950 the group published their algorithm and the results of their computation. They found that the forecast was of reasonable quality, though as they write, “It may be of interest to remark that the computation time for a 24-hour forecast was about 24 hours, that is, we were just able to keep pace with the weather.” Contrast that with Richardson’s years of computation. Certainly not a useful, or “operational”, forecast, but a promising start.
It didn’t take long to make more progress. The first operational computer forecast occurred in 1954 in Sweden. Others followed suit. In 1975, the ECMWF was founded, and over the coming decades became a world leader in weather forecasts.
The extra computational power let us not only realize Richardson’s fantasy, but also increase the resolution of our forecasts, incorporate more observations, and improve our models, eventually increasing our ability to predict into the future. You probably know that supercomputing capacity has increased exponentially over time for the last few decades:
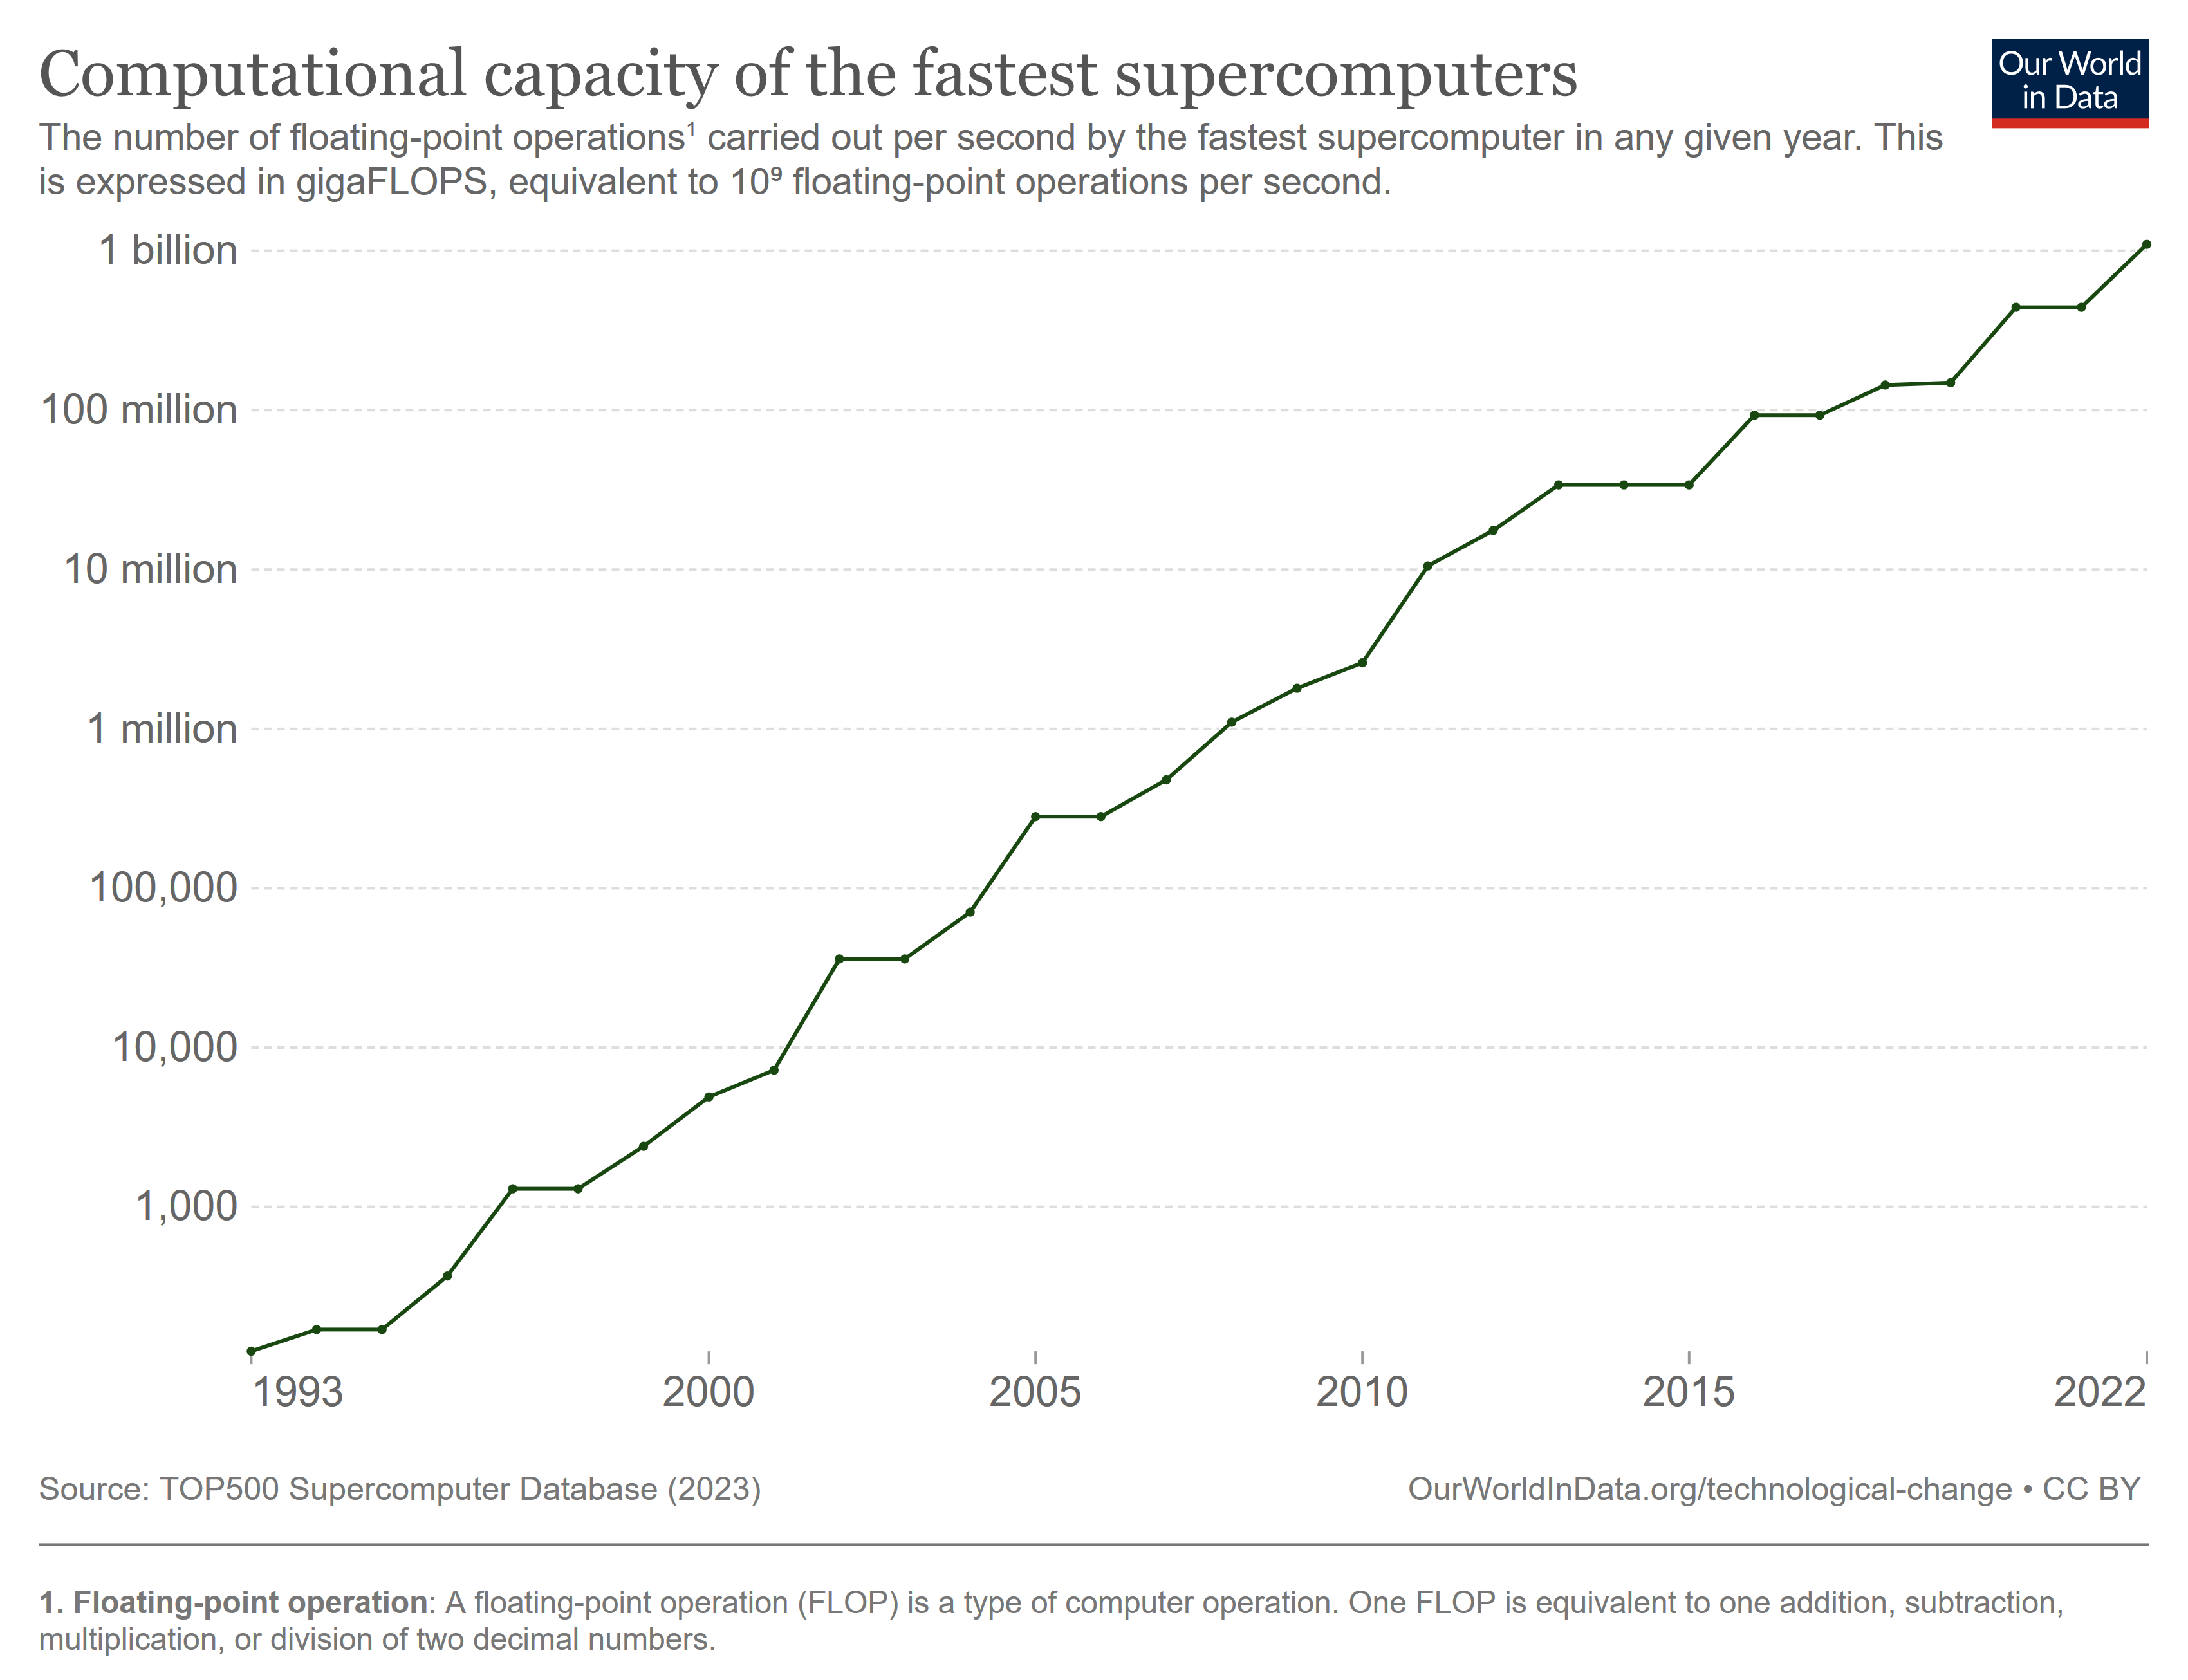 Note the logarithmic scale.
These gains helped ECMWF’s ability to predict the weather further out:
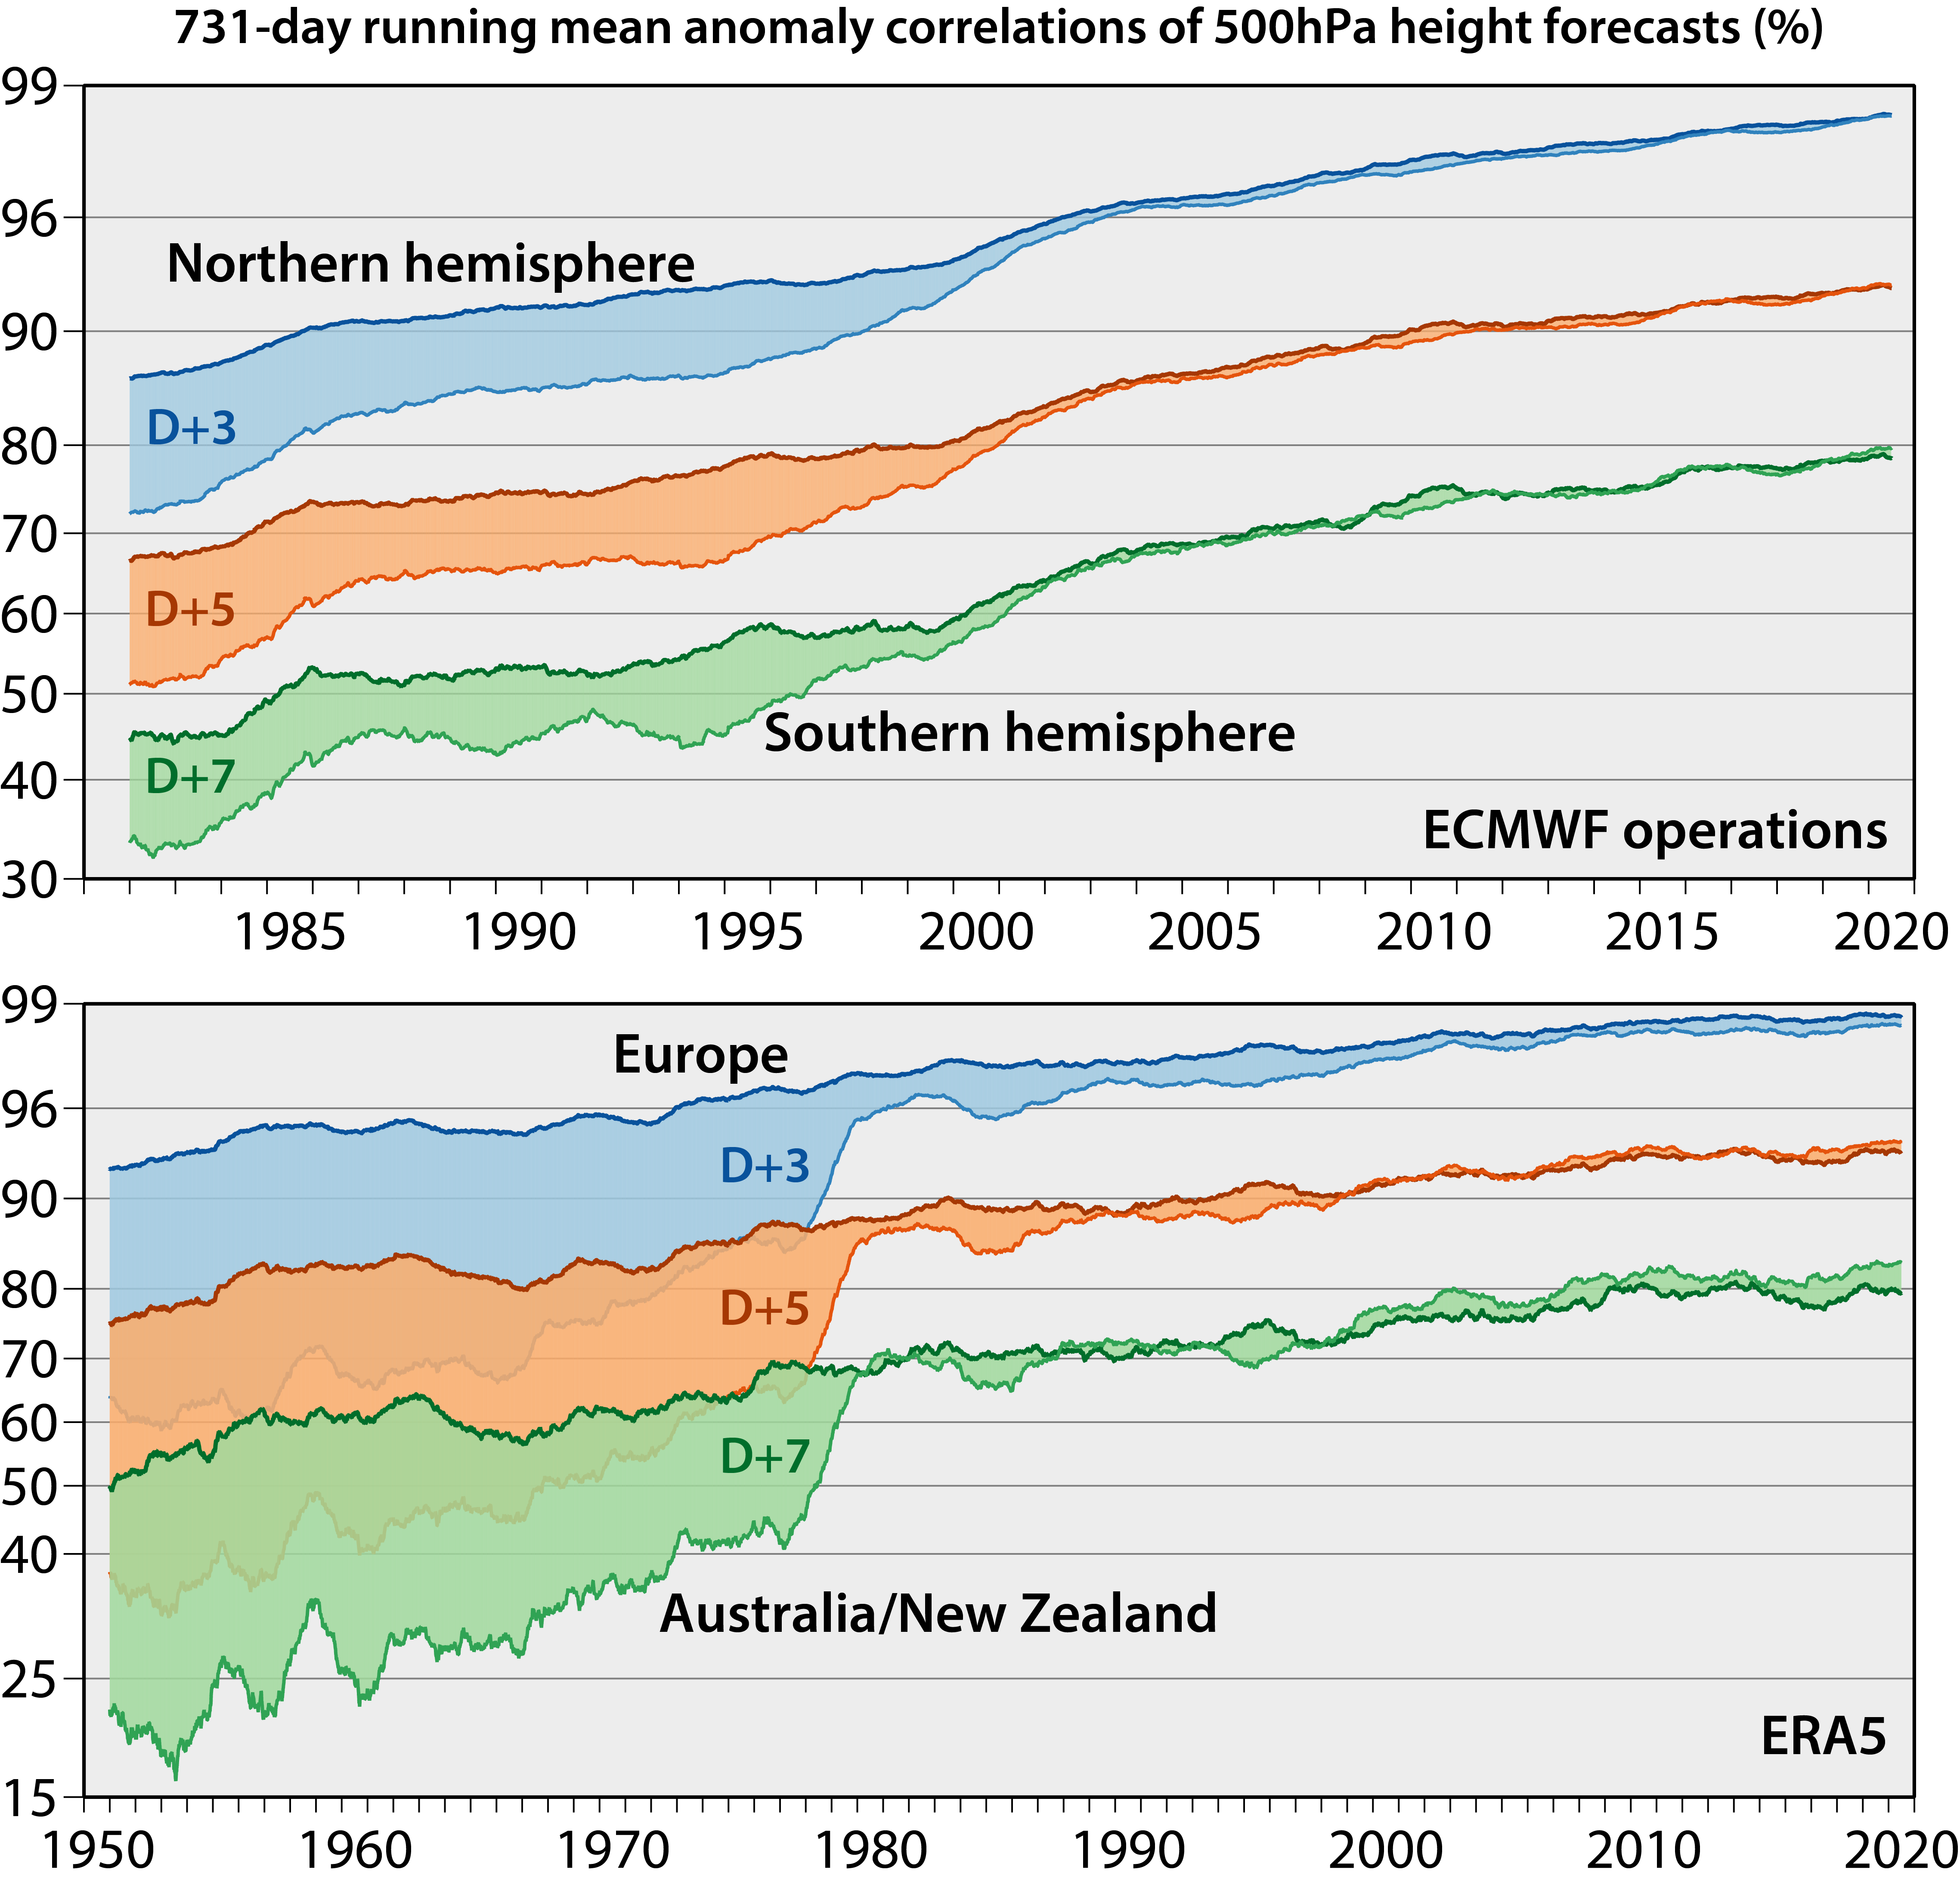 The evolution of forecast skill over time in different regions. D+3 means three days into the future, D+5 means five days into the future, and so on. Note that the vertical axis is a measure of forecasting skill (beware: the axis isn’t linear, but some funky broken scale). In this case, the skill has to do with predicting a certain pressure level, which affects the weather. The bottom panel has data for a longer time range, but only for specific regions.
There are two stories here. First, the Northern hemisphere had much better accuracy, then converged. From what I can tell, this is mainly due to differences in available observations. Second, despite the exponential increase in computational capacity with time (and all of the other improvements to our forecasting pipeline), we’ve only seen a corresponding linear increase in forecasting skill over time. This suggests to me that weather forecasting is a really hard problem! It also tells me that without advances in computing, we’d be very limited in what we can do.
Scientists aren’t done yet with forecasting. They are still working on understanding the atmosphere, increasing the quality and quantity of observations they can feed into their models, and improving the hardware they use to run their models. The hope is always making better predictions.
The story of progress in weather forecasting began with an insight: The weather is a physical system, so we can predict it using the laws of physics. But we can’t study the weather in a laboratory. Instead, it’s all around us, constantly evolving on local and global scales. The weather is such a vast system that it was initially a fantasy to hope we could ever predict it. But we did, and do every day. By combining scientific models with a worldwide observation system and massive computing power, we made weather forecasting into the operational infrastructure it is today. We activated its potential by making progress in all those areas, not just one or two. In other words: We created the right conditions for progress.
Thanks to Alex Telford, Elle Griffin, Ryan Puzycki, Heike Larson, Rob Tracinski, and Tommy Dixon for reading drafts of this piece.
Endnotes